Summary
This page describes the energy yield from the UEF solar PV installation in Aarhus, Denmark.
Here’s a short podcast episode produced with Google NotebookLM explaining the data below:
Data Overview
Here is the visualization and description of the data…
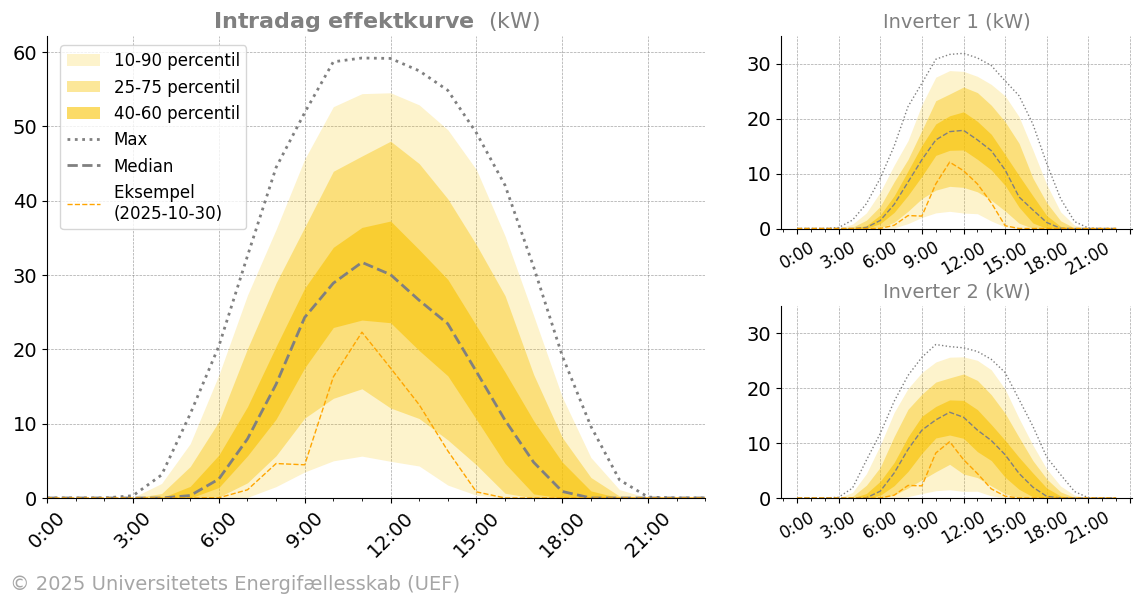
Figure panels overview:
- Panel 1: Intraday power supply
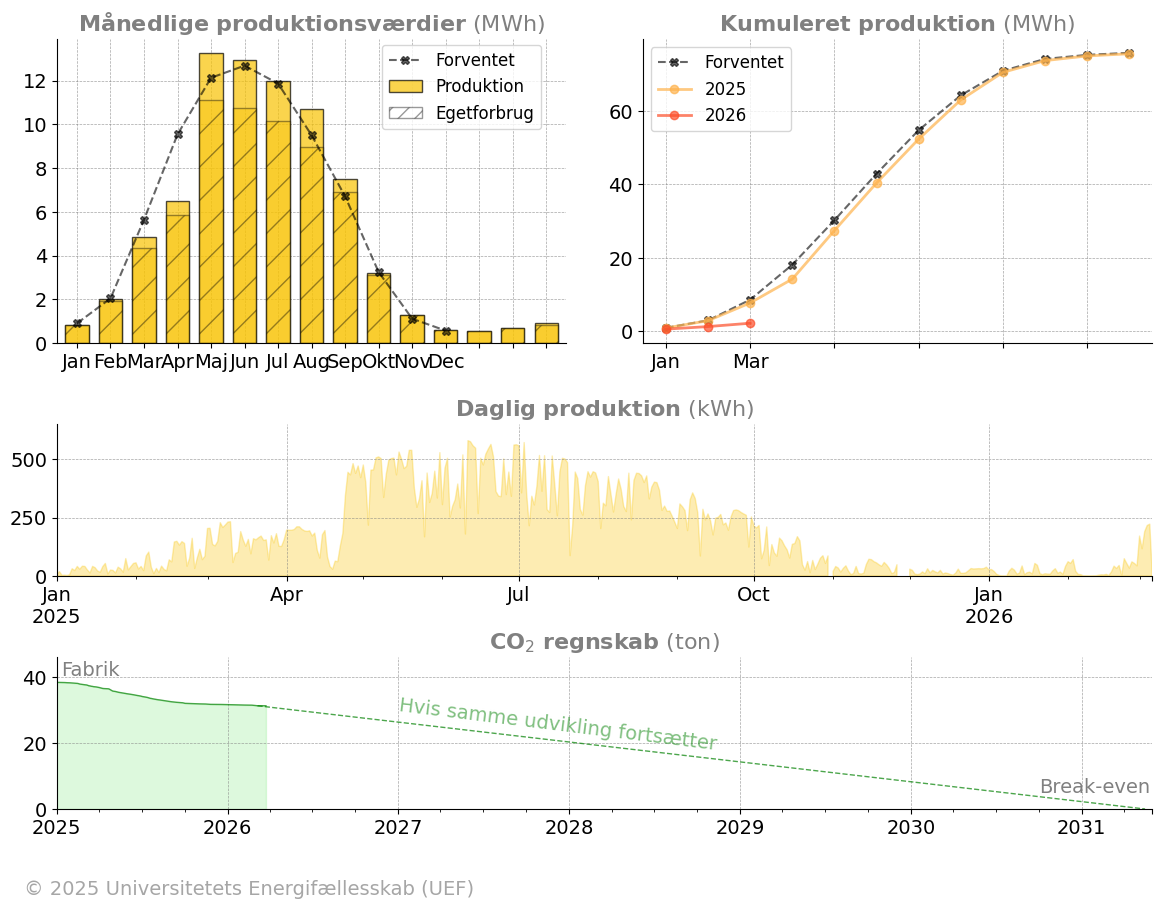
- Panel 2: Energy yield and CO2 footprint
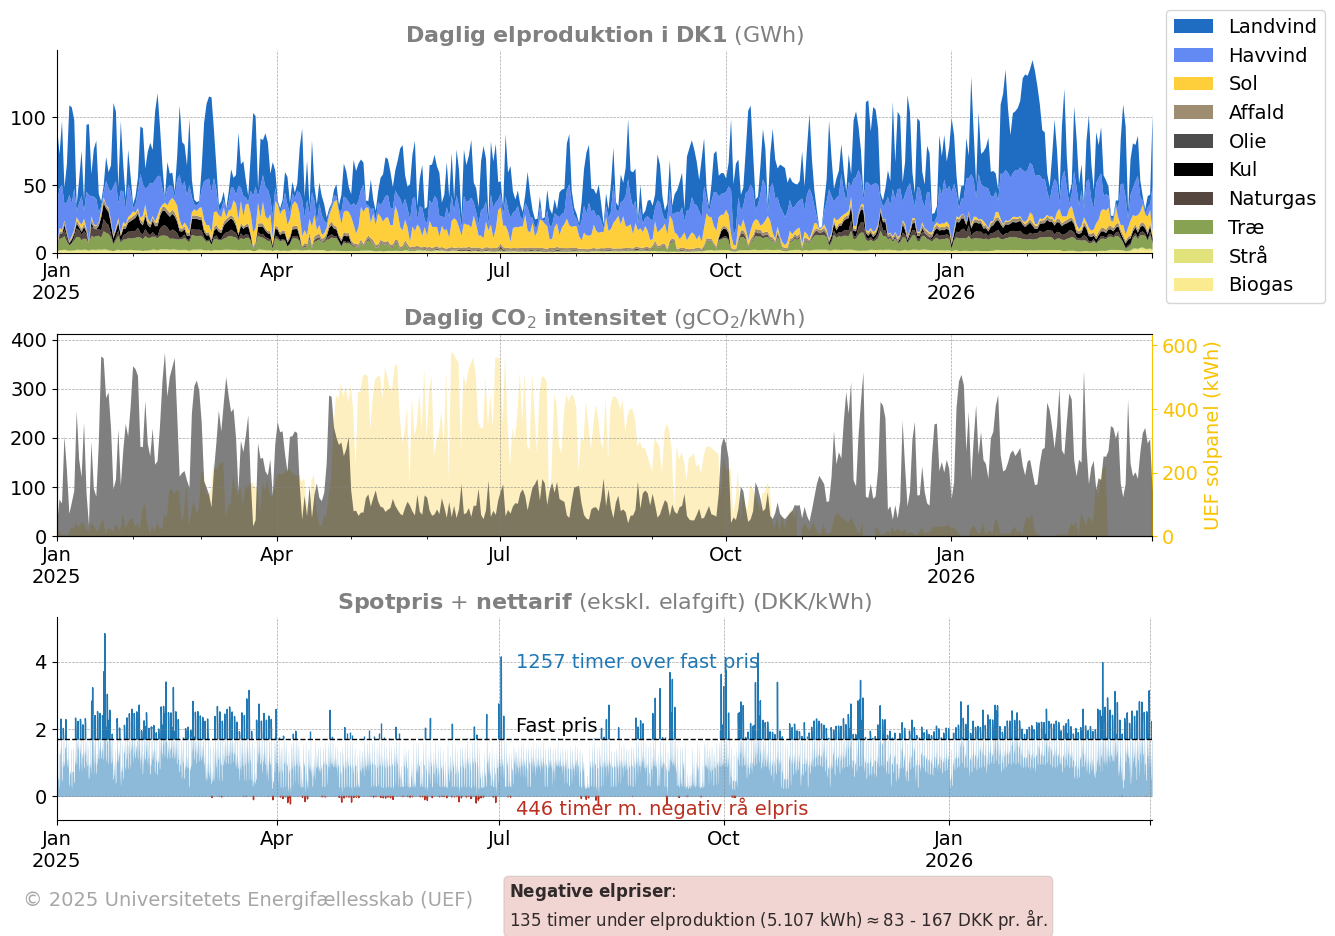
- Panel 3: Energy mix, CO2 intensity, and electricity prices of the local grid
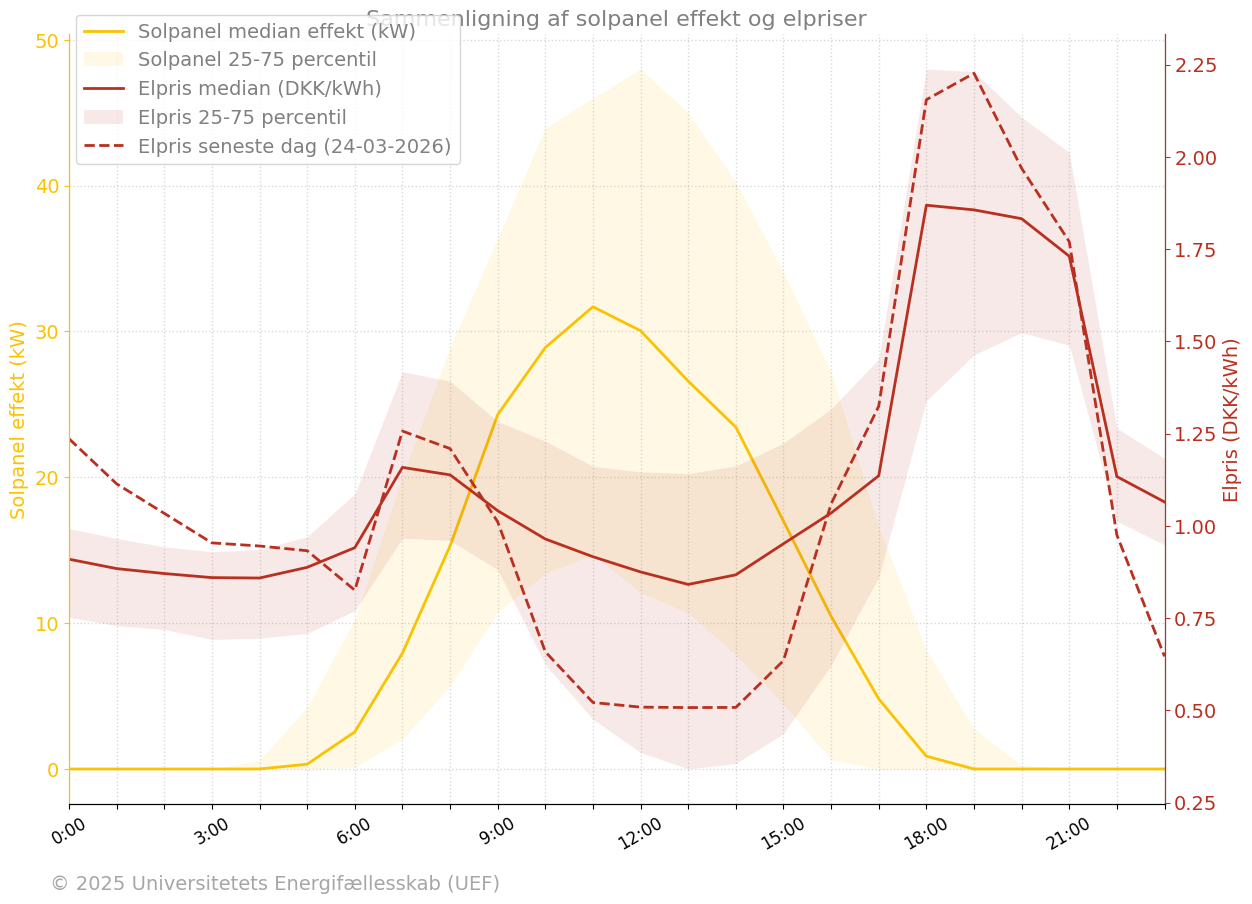
- Panel 4: Average electricity prices and PV yield intraday curves
The information shown on this site is updated using Github Actions. The workflow currently acquires data from the following sources:
- Reported energy yield from AURORA dashboard
- Inverter data from martavp/UEF
- Electricity prices from Energi Data Service
- Grid CO2 intensity from Energi Data Service
Furthermore, the energy yields are compared with simulated estimates from PVGIS.
The workflow includes a CO2 accounting of the emissions associated with manufacturing the panels, balanced by the avoided emissions from providing CO2-free electricity to the consumer. Here, avoided emissions are calculated based on the CO2-intensity of the electricity that would otherwise have been imported from the local grid.
The visualizations and data presented on this page are updated daily, while some data sources might be refreshed less frequently.